
Avoid Vanity Numbers: Resource Utilization Rate 70–85% for Managers
Resource utilization rate is the percentage of a person’s or team’s available working hours spent on productive or billable work, calculated as (hours used ÷ hours available) × 100. If your number looks off, the first move is a quick weekly audit comparing logged hours against true availability, not a scheduled 40, before you draw any conclusions. Healthy ranges shift by role, so the number only means something once you know what it’s being measured against.
TL;DR:
- Average individual utilization should be around 70% to 85%, with lower rates for managers and strategic roles, depending on role-specific standards.
- Accurate calculations require consistent exclusion of PTO, holidays, and training hours from available time, with weekly or monthly aggregation based on purpose.
- Poor data quality from misclassified, missing, or inflated hours can distort utilization by up to 18 points or more, making cross-team comparisons unreliable.
- Cross-check utilization metrics with rework, client satisfaction, and turnover rates to detect gaming or unsustainable workload patterns.
- Automated time tracking tools that reduce manual entry errors provide the most trustworthy utilization data for informed capacity management.
Table of Contents
- What Does Resource Utilization Rate Actually Measure?
- How Do You Calculate Resource Utilization Rate?
- Is a 3% Utilization Rate Good, or Any Other Number?
- What Mistakes Make Utilization Numbers Lie to You?
- How Can You Improve Resource Utilization Without Burning Out Your Team?
- What Tools and Reports Do You Need to Track Utilization Reliably?
- Worked Examples: Individual and Team Utilization Calculations
- Balancing Utilization With Sustainable Delivery
- How AYYES Helps You Track Utilization You Can Actually Trust
- Sources
- FAQ
What Does Resource Utilization Rate Actually Measure?
Resource utilization exists to answer one operational question: how much of the time you’re paying for is going toward work that generates value? That makes it a core input for capacity planning. The term gets muddy because it covers three related but distinct calculations:
- Billable utilization — hours invoiced to a client divided by available hours. This is the one agencies and consultancies live and die by.
- Productive utilization — hours spent on any value-generating work, billable or not (internal builds, product development, R&D).
- Capacity utilization — total hours worked against total theoretical capacity, often used at the team or department level for staffing decisions.
Setting the numerator and denominator consistently matters more than the formula itself. Decide upfront whether PTO, holidays, and training count as “available” hours or get excluded entirely, and apply that rule the same way across every person you track.
How Do You Calculate Resource Utilization Rate?
The standard formula is straightforward: divide hours actually used on productive work by hours available, then multiply by 100. The complexity lives in what counts as “available,” and getting that wrong is the single biggest source of misleading utilization numbers. Here’s a repeatable checklist for calculating a defensible rate:
- Collect actual hours worked, broken out by category (billable, internal, admin) from timesheets or a tracking tool.
- Establish available hours by starting with scheduled hours, then subtracting PTO, holidays, sick time, and mandatory training. Enterprise guidance consistently recommends this adjustment before you calculate anything, because skipping it inflates apparent capacity and makes utilization look artificially low.
- Compute the rate: (used hours ÷ adjusted available hours) × 100.
- Sanity-check the result against a second data point, like a manager’s gut read on workload, before treating it as fact.
Decide your aggregation window early. Weekly calculations catch outliers fast but bounce around with single days off; monthly numbers smooth out noise but hide short-term crunches. Most operations teams track weekly for individual coaching and monthly for capacity forecasting. Statistic Callout: A team member scheduled for 40 hours who takes one PTO day has 32 available hours that week. Skipping the PTO adjustment would understate their actual performance by nearly 18 points. 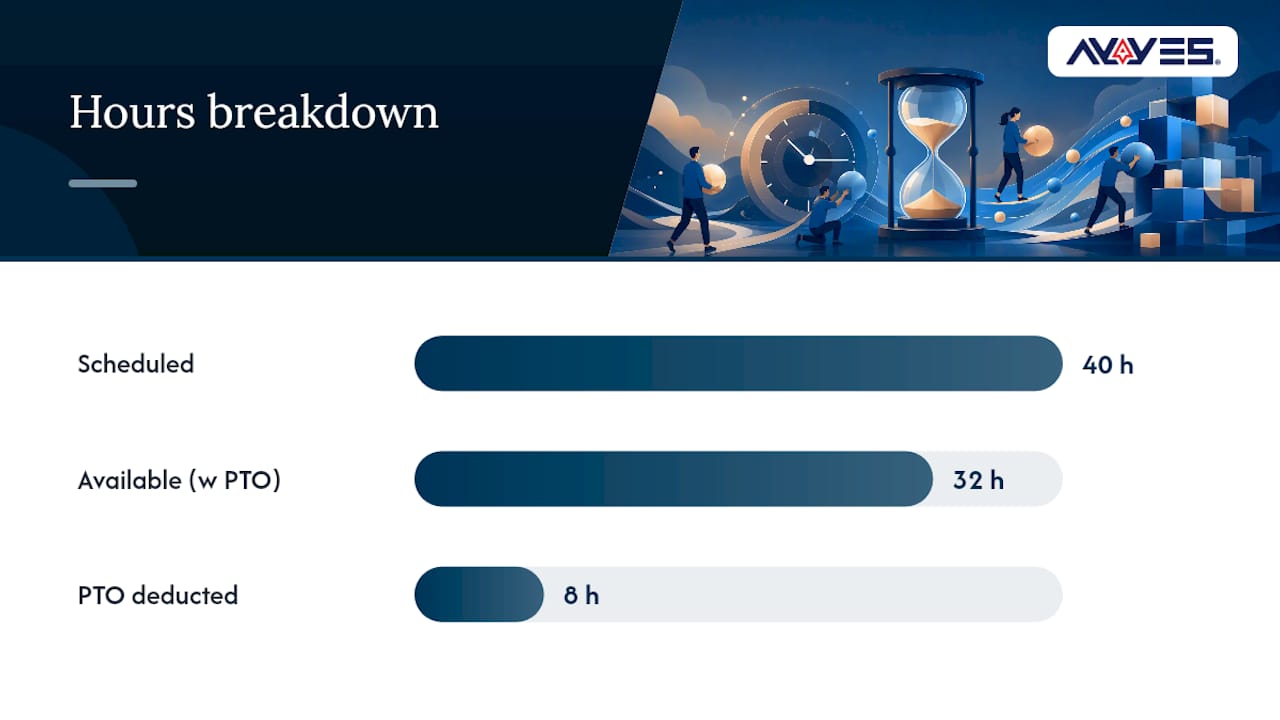
Is a 3% Utilization Rate Good, or Any Other Number?
A very low utilization rate is generally not good under any normal role definition. It usually signals either a serious tracking failure (hours aren’t being logged) or a person with almost no assigned productive work. Outside of that extreme, role-based benchmarks commonly fall between 70% and 85% for individual contributors doing delivery work.
- Individual contributors often aim for utilization roughly in the mid-70% to mid-80% range.
- Senior staff and specialists typically have slightly lower utilization expectations due to non-billable strategic activities.
- Managers and team leads generally have lower utilization rates because much of their work is non-billable coordination and oversight.
Context changes the math, too. Professional services firms lean toward the high end of these ranges because billable hours drive revenue directly. Internal operations and product development teams tolerate lower rates because unbilled time still produces roadmap value.
What Mistakes Make Utilization Numbers Lie to You?
Utilization tells you how full someone’s calendar is. It says nothing about whether the work was good, profitable, or necessary, and treating it as a stand-alone quality signal is where most utilization programs go wrong. The data itself breaks in predictable ways:
- Inconsistent PTO handling — some managers count vacation days as available hours, others don’t, making cross-team comparisons meaningless.
- Misclassified time — admin work logged as “billable” to protect someone’s numbers.
- Missing hours entirely — people who don’t log time accurately show artificially low utilization, not low workload.
- Metric gaming — padding timesheets, reclassifying downtime as “research,” or splitting one task across categories to hit a target.
Watch for a rate that looks perfect quarter after quarter with no variance. Pro Tip: Cross-check utilization against rework rates, client satisfaction scores, and voluntary turnover every quarter. If utilization is climbing while any of those three are declining, the number is being gamed or the workload is unsustainable, not improving.
How Can You Improve Resource Utilization Without Burning Out Your Team?
Improving utilization sustainably means fixing allocation and process, not just asking people to log more hours. Start with the interventions that fix root causes before touching individual workloads.
- Clean up your time data first. Enforce consistent categories across the team so “billable,” “internal,” and “admin” mean the same thing for everyone. You can’t optimize a number you can’t trust.
- Match skills to assignments deliberately. A senior engineer stuck on routine tickets is idle in the ways that matter, even at 100% utilization. Route work based on skill fit, not just who’s free.
- Cut context switching. People juggling five projects lose real hours to task switching that never shows up in a timesheet. Schedule focus blocks and cap active project counts per person.
- Build capacity buffers, not just full schedules. Plan for roughly 80% of theoretical capacity when forecasting, leaving room for the inevitable fire drill. Cross-train so no single person’s absence stalls a project.
- Forecast demand ahead of staffing decisions. Diagnostic approaches that flag pipeline gaps and skills mismatches early let you fix allocation before utilization drops, rather than reacting after the fact.
Track supporting KPIs alongside utilization so you’re not optimizing one number in isolation: project margin, rework rate, and voluntary attrition. Pro Tip: Automating time capture through a tool tied to your project plans removes the manual logging friction that causes most data quality problems in the first place. 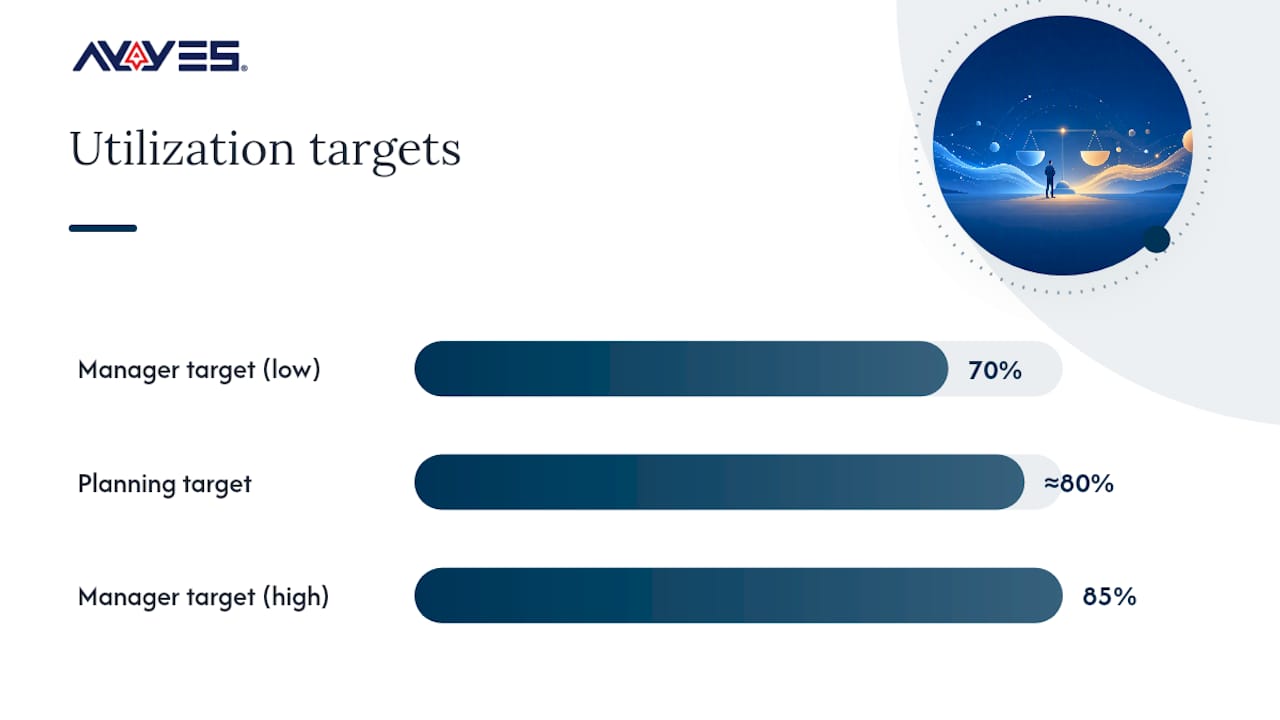
What Tools and Reports Do You Need to Track Utilization Reliably?
A trustworthy utilization program needs four data points at minimum: actual hours worked, available hours (adjusted for PTO and training), time categories, and project or client tags. Without all four, you’re calculating a rate that can’t survive scrutiny. Useful reports build from that base:
- Per-person heatmap showing daily or weekly utilization to catch overload or idle time early.
- Team trend line over 8 to 12 weeks to separate a bad week from a real pattern.
- Outlier list flagging anyone above 95% or below 50% for manager review.
- Utilization by project to see which engagements are consuming disproportionate hours.
Automated time tracking reduces the friction that causes most bad data, since manual timesheet entry is where hours get forgotten or misclassified. If your organization uses monitoring tools alongside tracking, be transparent with the team about what’s captured and why. Note also that “utilization” means something different for infrastructure: cloud platforms define CPU and memory utilization using sample averages and allocation-versus-used ratios, a separate discipline from tracking human hours. Set a reporting cadence and stick to it: weekly views for managers coaching individuals, monthly rollups for leadership making staffing calls.
Worked Examples: Individual and Team Utilization Calculations
Numbers make the formula concrete faster than any explanation.
- Individual, weekly: Maria is scheduled for 40 hours and takes one PTO day (8 hours), leaving 32 available hours. She logs 26 productive hours. Her utilization is 26 ÷ 32 × 100 = 81.25%, solidly within the typical IC range.
- Team, monthly: A five-person team has 800 combined available hours for the month after PTO adjustments. They log 620 productive hours. Team utilization is 620 ÷ 800 × 100 = 77.5%. Because averages can mask extremes, check the individual spread too. One person at 95% and another at 55% average to a healthy-looking number while hiding a real imbalance.
- Leadership summary template: report period, average utilization, median utilization, percentage of team above 90%, percentage below 60%, and one line on what changed since last period.
Balancing Utilization With Sustainable Delivery
The mistake most organizations make isn’t tracking utilization. It’s picking one target number and applying it to everyone from junior analysts to department heads. Role-aware ranges aren’t a nice-to-have; they’re the difference between a metric that guides decisions and one that just generates anxiety. The stronger discipline is refusing to look at utilization alone. Pair it with margin, rework, and turnover data every time you review it, because a rising rate with declining quality is not progress, it’s a countdown. Teams that get this right treat utilization as a diagnostic tool for spotting imbalance early, not a performance score to maximize. Resource efficiency, in the broader economic sense, has always been about doing more with what you already have rather than simply adding more hours. The same logic applies at the team level. Fix allocation and data quality before you touch anyone’s schedule.
— Mark
How AYYES Helps You Track Utilization You Can Actually Trust
Every calculation in this guide depends on one thing: hours data you can trust. That’s the part most teams get wrong, not the formula. AYYES closes that gap with time tracking that captures actual worked hours automatically, rather than relying on end-of-week guesswork from your team. A few specifics that matter for utilization reporting:
- Automated time tracking paired with features that reduce manual entry errors and missing hours.
- Screenshot captures and app and website usage tracking to help ensure “productive hours” reflect real activity, not just a logged number.
- Built-in reporting and dashboards that break down utilization by person, project, and category.
- Timesheet and PTO tracking that integrate with available-hours baselines, aiming to simplify adjustment processes.
That combination means the utilization rate you calculate next week is built on clean data from day one, not patched together from five different sources. 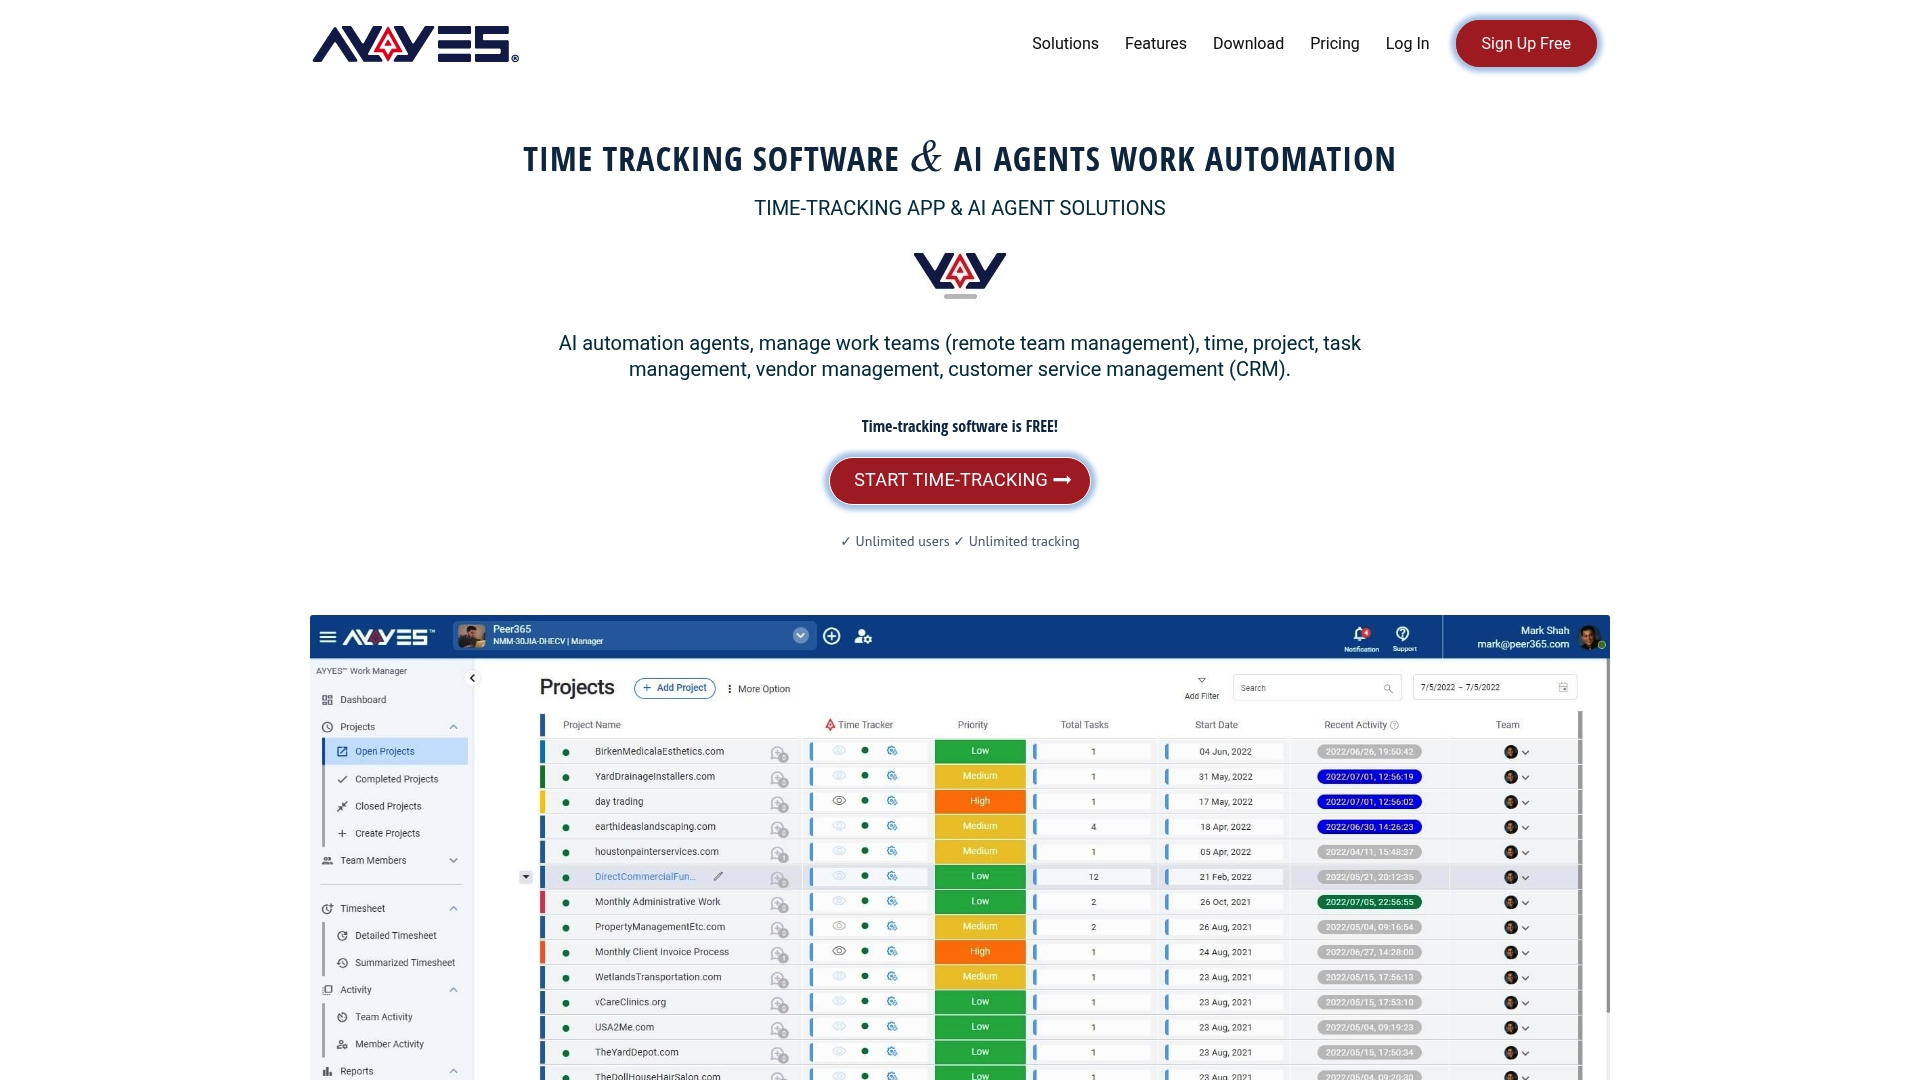 AYYES is also accessible for smaller teams, with a free plan for up to 12 members. Paid plans are $0.99 per seat/month or $0.88 per seat/month when billed annually. Screenshot tracking and app and website monitoring are available on paid plans. If your current setup still runs on manual timesheets and guesswork, start a trial at AYYES and see what your real utilization numbers look like.
Sources
FAQ
How Do I Calculate Resource Utilization Rate?
Divide productive or billable hours by available hours (scheduled hours minus PTO, holidays, and training), then multiply by 100. Adjusting available hours before dividing is what keeps the result accurate rather than inflated.
Is a 3% Utilization Rate Good?
No. A rate that low almost always points to a tracking failure or someone with virtually no assigned work, not a healthy staffing level.
What Does Resource Utilization Mean
It measures the percentage of someone’s available working hours spent on productive or billable work. It’s a capacity signal, not a direct measure of quality or profitability, so it works best paired with other KPIs.
Can You Give an Example of Resource Utilization
Tools like AYYES calculate this automatically from tracked time and PTO records rather than requiring a manual spreadsheet.
What’s the Difference Between Billable and Productive Utilization
Billable utilization counts only hours invoiced to a client, while productive utilization includes any value-generating work, billed or not. Teams doing internal product development should track productive utilization, since billable alone would understate their real output.